
China’s growth slides again - What are the implications?

China’s economy continued its downward trend in the third quarter with growth of just 4.8% after 5.2% in the second quarter and 5.4% in the first. The weakness was broad-based, with retail sales, fixed asset investment and industrial output data all tepid. Combined with increasing headwinds from the Sino-US trade war, the latest data argues that Beijing needs to shake off any complacency and continue its easing policy to protect growth.

Although the official 5.0% growth target remains within reach even if GDP were to grow by 4.6% in the final quarter of this year, deflationary forces remain entrenched. Third-quarter nominal GDP rose by only 3.7%, down from 3.9% and 4.6% in the two preceding quarters. That puts China in its longest period of deflation  (10 quarters in a row) since the 1990s (see Exhibit 1) and implies that policy easing so far has not been enough to stabilise prices.
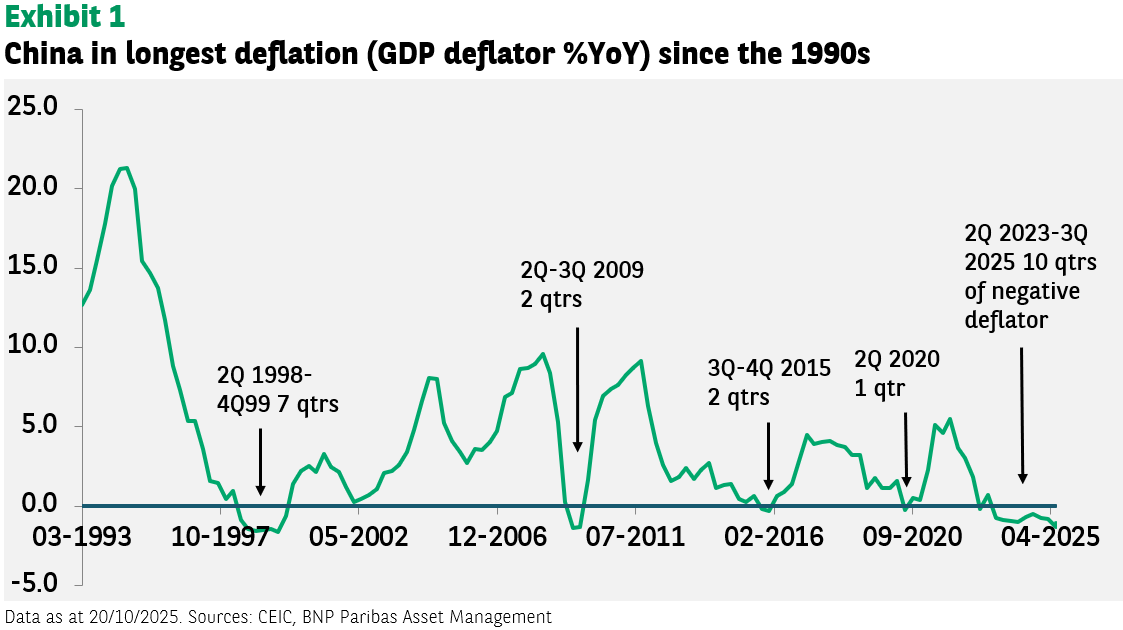
Exhibit 1: China in longest deflation (GDP deflator %YoY) since the 1990s A line graph titled "Exhibit 1 China in longest deflation (GDP deflator %YoY) since the 1990s" showing GDP deflator %YoY on the y-axis from -5.0 to 25.0, and dates from 03-1993 to 04-2025 on the x-axis. The green line illustrates China's GDP deflator percentage year-on-year, showing several periods of deflation (below 0%). Key deflationary periods are annotated: "2Q 1998-4Q99 7 qtrs," "2Q-3Q 2009 2 qtrs," "3Q-4Q 2015 2 qtrs," "2Q 2020 1 qtr," and "2Q 2023-3Q 2025 10 qtrs of negative deflator," highlighting the current period as the longest since the 1990s.

It is not just policy easing

To turn things around requires more than just further policy easing. Beijing must keep up with its two-prong policy approach of: 

  1. Structural reforms to improve systemic efficiency and
  2. More fiscal and monetary easing to keep domestic demand from faltering under the deflationary pressures of structural reforms. 

Beijing seems to have come to terms with the need for more assertive easing and has stepped up its efforts in that direction. On 17 October, the Ministry of Finance announced a new RMB 500 billion local government bond quota to reliquefy local government balance sheets. It also pre-approved some of the 2026 government bond quota to support more fiscal spending and infrastructure investment.

Since late 2024, Beijing has announced some large-scale easing measures, including targeted cash transfer to families with young children, tuition subsidies for pre-school education, and significant infrastructure projects, notably a mega ($1.2 trillion) hydro project in Tibet and a new 2,000-kilometre railway linking Xinjiang and Tibet.

Confidence is key

Chinese consumers are not budget constrained because household savings have risen sharply (see Exhibit 2). What they lack is confidence, which is pegging consumption down.
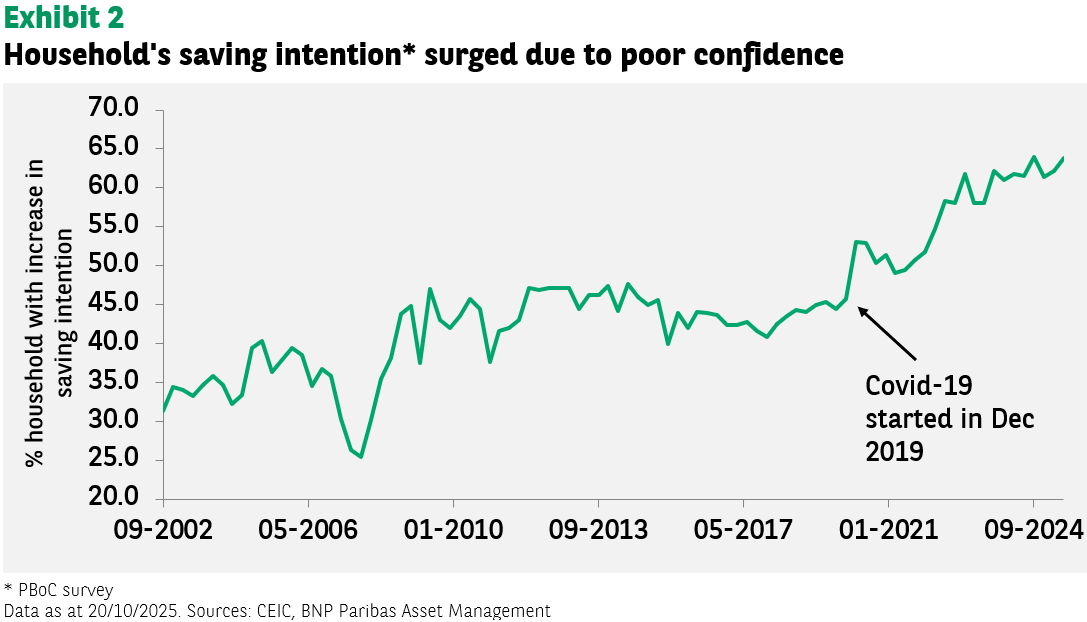
Exhibit 2: Household's saving intention surged due to poor confidence A line graph titled "Exhibit 2 Household's saving intention surged due to poor confidence" showing "% household with increase in saving intention" on the y-axis from 20.0 to 70.0, and dates from 09-2002 to 09-2024 on the x-axis. The green line depicts the percentage of households with an increased saving intention. An annotation points to "Covid-19 started in Dec 2019," after which the saving intention shows a sharp and sustained increase, reaching over 60% by 09-2024, suggesting a surge in saving due to poor confidence.

Household savings can be seen as pent-up demand that could be released when confidence returns. From a policy perspective, Beijing must keep up with more aggressive easing to stabilise the economy (including the property sector) and restore consumer confidence and, hence, private consumption and investment.

Has Beijing delivered?

There are signs that China’s economy may have start responding to Beijing’s additional easing since late last year. Firstly, the narrowing of the negative M1-M2 growth gap to its smallest since May 2021 (see Exhibit 3) is a sign that households are directing their idle savings towards spending and the asset market.

The smaller negative gap indicates a shift of funds from M2 (fixed deposits) to M1 (current accounts) and from there on to the stock market. The latter step is vindicated by the rising number of retail brokerage accounts (see Exhibit 4), perhaps an initial sign of public confidence recovering.
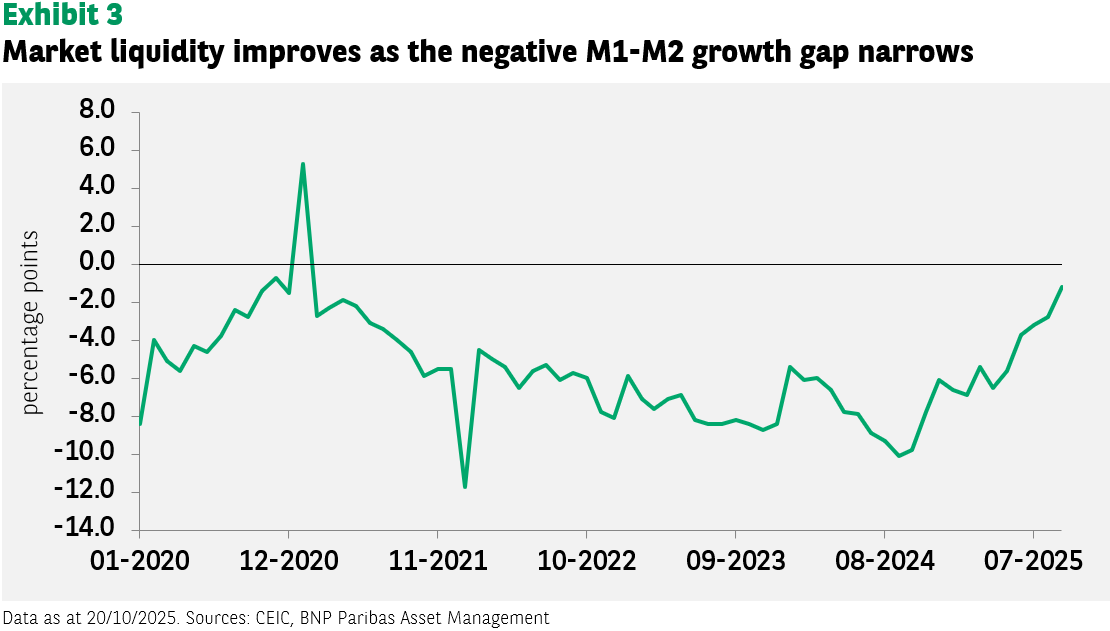
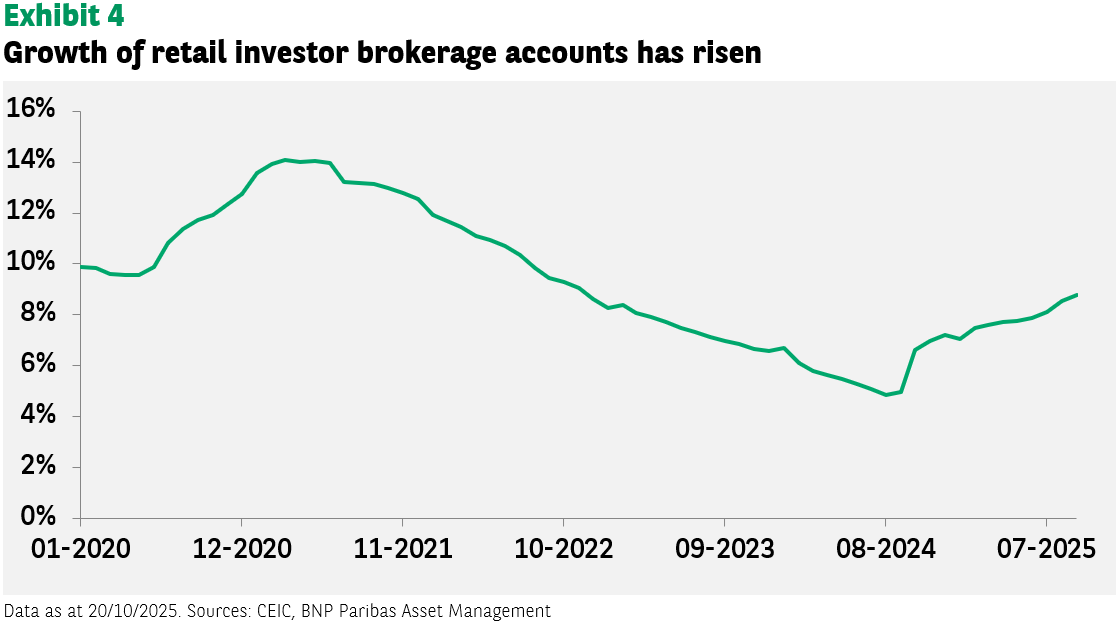
Exhibit 3: Market liquidity improves as the negative M1-M2 growth gap narrows A line graph titled "Exhibit 3 Market liquidity improves as the negative M1-M2 growth gap narrows" showing "percentage points" on the y-axis from -14.0 to 8.0, and dates from 01-2020 to 07-2025 on the x-axis. The green line represents the negative M1-M2 growth gap, which shows significant fluctuations. It starts around -8.0 in early 2020, briefly turns positive in late 2020, then largely remains negative, with a notable narrowing (moving towards zero) from late 2024 to 07-2025, indicating improving market liquidity.

Exhibit 4: Growth of retail investor brokerage accounts has risen A line graph titled "Exhibit 4 Growth of retail investor brokerage accounts has risen" showing percentage on the y-axis from 0% to 16%, and dates from 01-2020 to 07-2025 on the x-axis. The green line illustrates the growth of retail investor brokerage accounts, peaking around 14% in late 2020, then gradually declining until early 2024, after which it shows a steady increase, reaching over 8% by 07-2025.

Secondly, Beijing’s monetary easing and debt-swap programmes have helped reliquefy local government balance sheets and recapitalise banks to clear the logjam of hidden government debt. As a result, the credit impulse has finally recovered (see Exhibit 5).
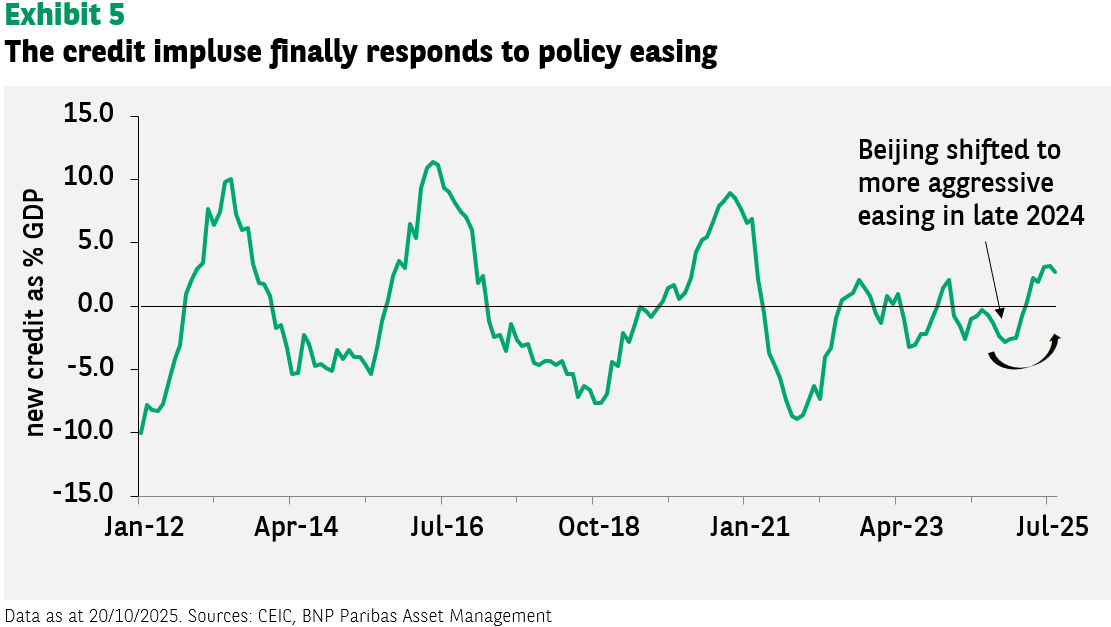
Exhibit 5: The credit impulse finally responds to policy easing A line graph titled "Exhibit 5 The credit impulse finally responds to policy easing" displaying "new credit as % GDP" on the y-axis, ranging from -15.0 to 15.0, and dates from Jan-12 to Jul-25 on the x-axis. The green line shows cyclical fluctuations in credit impulse. An annotation points to a period around late 2024, stating "Beijing shifted to more aggressive easing in late 2024," and an arrow indicates an upward trend in the credit impulse following this period, suggesting a response to policy easing.

Drivers for market recovery

Increasing growth headwinds amid weak growth momentum are forcing policymakers to ease policy further. Meanwhile, the collapse of the housing market leaves equities as the other, if not only,S viable investment outlet for households’ excess savings.

Sustaining the economic recovery and stock market rally requires more structural reform and policies to boost demand.

Granted, the A-shares market no longer looks exceptionally cheap. However, as more signs of economic stabilisation and policy easing emerge, portfolio flows should start returning to Chinese stocks. Already, net Stock Connect northbound flows (an indication of foreign buying of A-shares) are returning (see Exhibit 6).
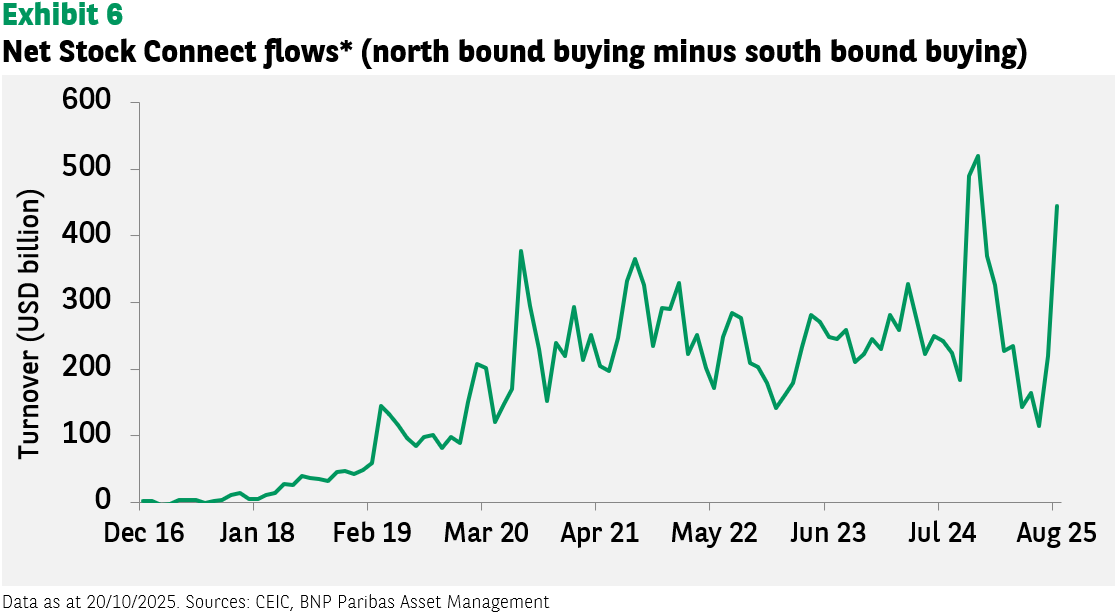
Exhibit 6: Net Stock Connect flows (north bound buying minus south bound buying) A line graph titled "Exhibit 6 Net Stock Connect flows (north bound buying minus south bound buying)" showing Turnover (USD billion) on the y-axis from 0 to 600, and dates from Dec 16 to Aug 25 on the x-axis. The green line shows a fluctuating trend, generally increasing from Dec 16, with significant peaks around Mar 20, Apr 21, and a sharp rise in Jul 24, reaching over 500 USD billion, before a slight dip and then another increase towards Aug 25. The graph illustrates the net flow of capital through the Stock Connect program, indicating periods of increased northbound buying.

Barring any macroeconomic or policy hiccups, momentum could also fuel further upside for China’s retail-dominated stock market. Sitting on massive savings and fuelled by FOMO – the ‘fear of missing out’ – Chinese retail investors could continue to pile in, pushing Chinese stocks to overshoot their mean reversion levels.

Important information

This advertisement has not been reviewed by the Monetary Authority of Singapore. Please note that articles may contain technical language. For this reason, they may not be suitable for readers without professional investment experience. Any views expressed here are those of the author as of the date of publication, are based on available information, and are subject to change without notice. Individual portfolio management teams may hold different views and may take different investment decisions for different clients. This document does not constitute investment advice. The value of investments and the income they generate may go down as well as up and it is possible that investors will not recover their initial outlay. Past performance is no guarantee for future returns. Investing in emerging markets or specialised or restricted sectors is likely to be subject to a higher-than-average volatility due to a high degree of concentration, greater uncertainty because less information is available, there is less liquidity or due to greater sensitivity to changes in market conditions (social, political and economic conditions). Some emerging markets offer less security than the majority of international developed markets. For this reason, services for portfolio transactions, liquidation and conservation on behalf of funds invested in emerging markets may carry greater risk. This material is produced for information purposes only and does not constitute: 1. an offer to buy nor a solicitation to sell, nor shall it form the basis of or be relied upon in connection with any contract or commitment whatsoever or 2. investment advice. It does not have any regards to the specific investment objectives, financial situation or particular needs of any person. Investors should seek independent professional advice before investing, or in the absence thereof, he/she should consider whether the investments are suitable for him/her.

Back to Top